Want to be informed about air pollution data during COVID-19 restrictions?

Massive air quality changes observed during COVID-19 restrictions

Two major air chemical components, which are also atmospheric pollutants, are shown here as a way to detect the changes in air pollution during the period of COVID-19 restrictions. Weekly values from the start of the year for Nitrogen Dioxide (NO2) and Carbon Monoxide (CO), both of them as total column, are displayed for the first weeks of the year (from 1st January).

As we discussed in our previous post, acknowledging the tragic impact of the COVID-19 outbreak on lives and livelihoods, this unprecedented situation presents us with an interesting opportunity to uncover what happens to the air quality around us and worldwide. The data presented here are taken from the Copernicus Atmosphere Monitoring Service (CAMS). Specifically, data come from the CAMS Near Real Time (NRT) Re-analysis which is available a few days behind real time. Re-analyses are combinations of observations (from ground stations, satellite, etc.) and a very advanced physical model. The CAMS NRT Re-analysis is downloaded at ca. 50 km x 50 km horizontal spatial resolution and every six hours (namely four values daily, at 00:00 UTC, 06:00 UTC, 12:00 UTC and 18:00 UTC).

Given the dependency of these variables of external conditions such as type of weather, economic productivity, traffic, etc. a week average is about the shortest time recommended when comparing these type of data across years, though monthly averages would perhaps be more appropriate. As we know, the restrictions due to the coronovirus have have been occurring at different times in various parts of the globe so weekly averages help us better relate these changes with the times the restrictions have been enforced. For a proper comparison, we would also need to assess external factors, so the data below need to be interpreted with a grain of salt. Also, due to the nature of these data there can be discrepancies between the CAMS NRT Re-analysis and the maps which often appear on the web and derived from Sentinel-5P/TROPOMI. Importantly, some, though not all, of these estimates are flawed as discussed in this blog from CAMS.

The movies show the weeks of the year (available to date, i.e. currently week 26) grouped into four, with the following pattern: full field for 2019 (top left), full field for 2019 (top left), difference between 2020 and 2019 (positive means higher values in 2020 compared to 2019, and vice-versa, bottom left), and difference between 2020 and 2019 as a percentage (bottom right). Five views are shown for each variable: Global, Europe, (a large part of) Asia, North America and Middle East. The number in square bracket on the titles is the weighted average for the region. These images will be regularly updated as more recent data become available. Monthly averages are avaialble on request.

For further information, please contact Prof. Alberto Troccoli (alberto.troccoli -at- wemcouncil.org

Home

Data courtesy of Copernicus Atmosphere Monitoring Service (CAMS)

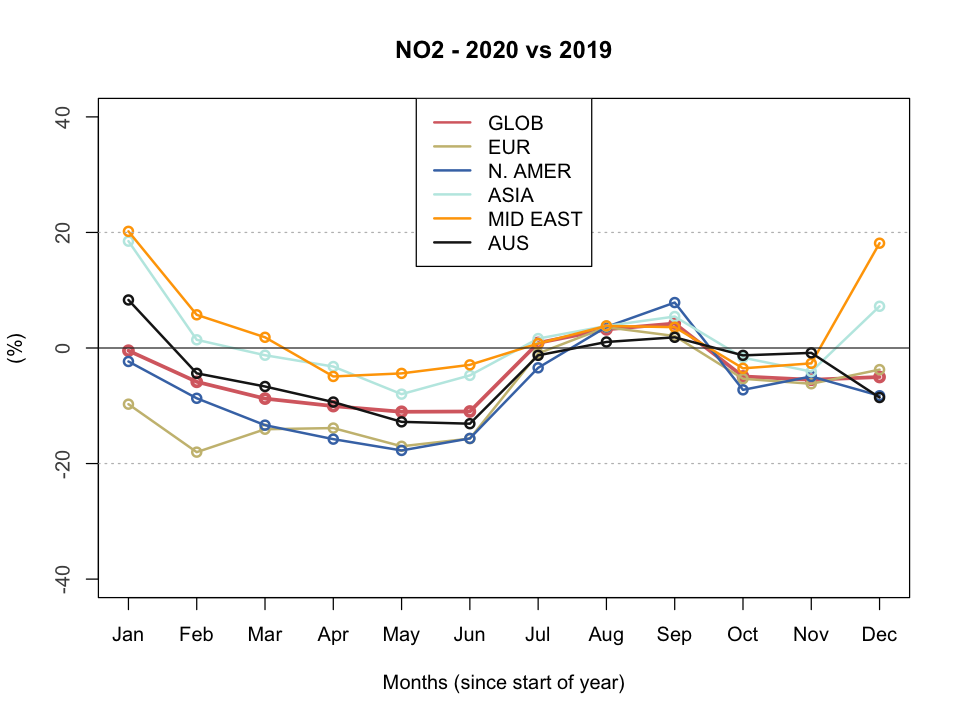
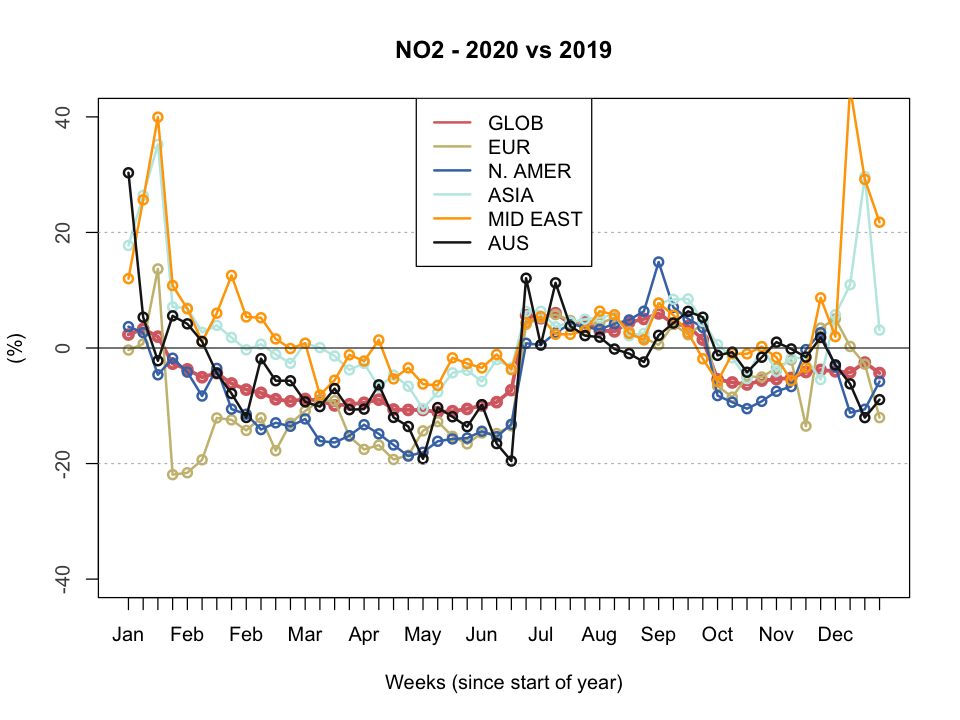
Nitrogen Dioxide (NO2, in 10 -7 kg m-2)

Area averages (same areas in maps below plus Australia) of percentage change of 2020 vs 2019 for NO2 as a function of month of the year
Area averages (same areas in maps below plus Australia) of percentage change of 2020 vs 2019 for NO2 as a function of week of the year
 

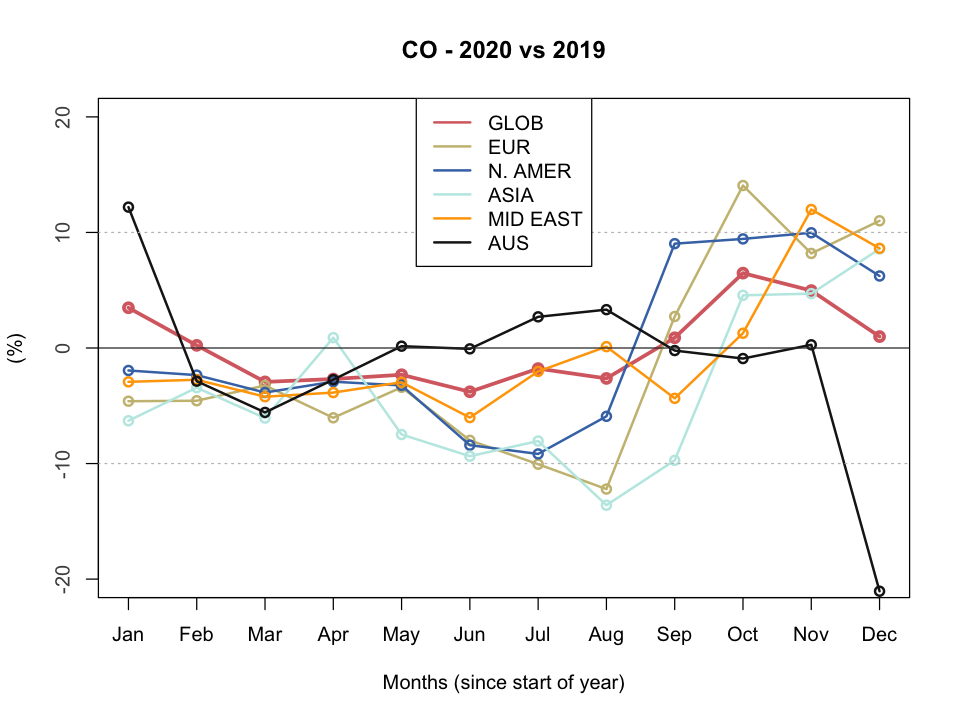
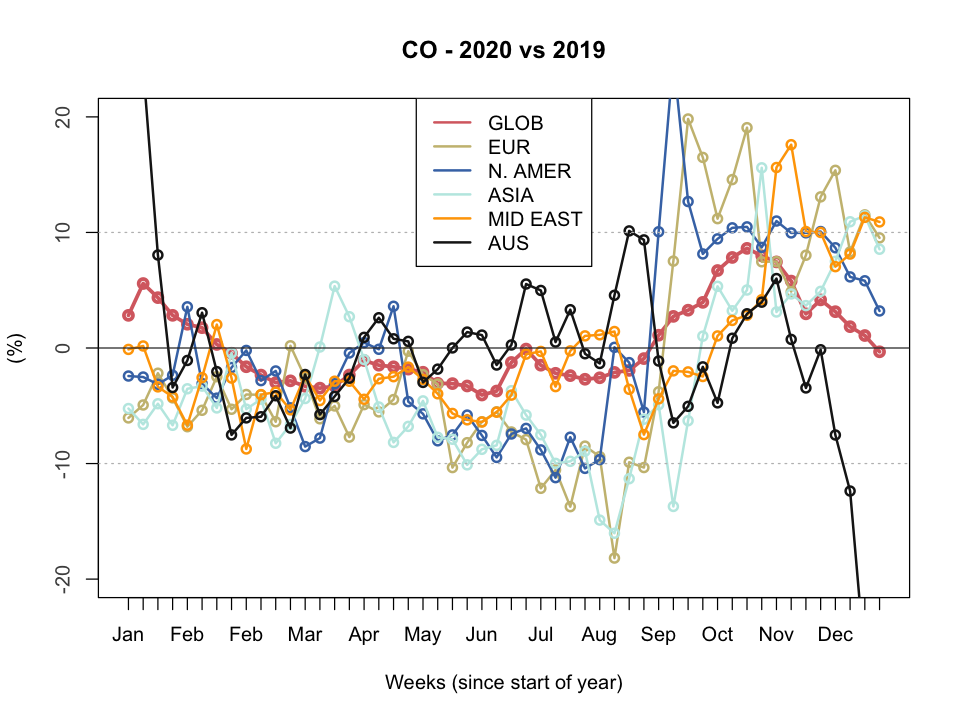
Carbon Monoxide (CO, in 10 -4 kg m-2)

Area averages (same areas in maps below plus Australia) of percentage change of 2020 vs 2019 for CO as a function of month of the year
Area averages (same areas in maps below plus Australia) of percentage change of 2020 vs 2019 for CO as a function of week of the year
 

Press Release – Take a rain check: How climate variations affect worldwide socio-economic activity

A new paper by Prof. Alberto Troccoli exploring the relationship between socio-economic activity and climate and geography variables has been published today.

The documented link between socio-economic activities and the climate goes back centuries. While studies have shown a link between latitude and average temperature and economic output, through a country’s Gross Domestic Product (GDP) for example, other meteorological variables also have an important part to play.

Continue reading “Press Release – Take a rain check: How climate variations affect worldwide socio-economic activity”

What the unexpected COVID-19 virus outbreak teaches us about our environment

Written by Prof. Alberto Troccoli. Edited by Debbie Woodliffe.

The dramatic spread of the COVID-19 Coronavirus has led to several countries restricting the movement of people, including air travel. Previously, we’ve only seen government responses like this when concerned with more terrorist-related incidents – such as the tragic events of September 11 nearly twenty years ago when air traffic ground to a halt for several days. The fact that a virus is causing a larger, more extreme reaction is unheard of.

But this COVID-19 outbreak does present us with an interesting opportunity to uncover what happens to the air quality, and pollution in general, when human induced emissions are forcibly halted.

Fig. 1 – Cases of Coronavirus worldwide. Source: WHO, via BBC.

Removing the human element

These new striking images from NASA and the European Space Agency (ESA) show significant decreases in nitrogen dioxide (NO2) over China since the restrictions began. It’s pretty clear that this rapid drop in NO2 is mainly due to the remarkable reduction in human activity as a consequence of the coronavirus outbreak. Even more impressive changes are seen when you focus specifically on the epicentre of the COVID-19 outbreak in the Wuhan region.

Fig. 2 – Change in No2 concentration. Source: NASA and ESA.

Almost by coincidence, Italy has also been hit, particularly in Lombardy in the north which is one of the most polluted areas in Europe in terms of air quality. Now on total lockdown, this country has the largest number of COVID-19 cases in the whole of Europe.

But, similarly to China, the highly industrialized region of Lombardy in northern Italy has seen a drastic improvement in air quality since the lockdown began. While there may be meteorological factors at play here, it’s almost inevitable that this reduction is a direct consequence of the reduced traffic and economic activity.

What can we learn from the COVID-19 outbreak and the pollution reduction?

First and foremost, it seems evident that a drastic reduction in economic activity and traffic can lead to a sudden (within days as opposed to years) improvement in air quality. We’re not at all suggesting that this sort of economic pause is an exercise worth carrying out just for the sake of seeing a drop in NO2 or PM10 measurements. Particularly given the drastic drop in the stock market which has wiped out over 15% of value in just a few weeks. But it is worth considering how we can conduct business in a way that is more balanced with the environment, and ultimately, with our health.

Fig. 3 – Particulate (Pm10) concentration on 22 February 2020 (left, before outbreak in Italy) and 2 March 2020 (right). Red is for values between 50 and 100 µg/m³ and cyan for values from 0 to 20 µg/m³ (yellow are in between the red and cyan). Source: Arpa Lombardia.

Think about it. If we all adopted a greener way of doing business, almost paradoxically, the better air quality might allow our bodies to be stronger and potentially be more efficient at battling unwarranted respiratory viruses like COVID-19.

Embracing an environmentally friendly future

But how can we achieve such reductions in pollution without damaging the economy? The fact is that the solutions are already available to us, if only we were more willing to embrace change.

For instance, imagine what an (almost) entirely electric fleet would do for the quality of the air? And what if there were enough wind and solar parks, as well as hydro power, to produce enough electricity to displace fossil fuel-based power plants? But it’s not only large changes. What if we decided to shop more locally instead of importing? It could reduce the movement of goods and benefit your local economy. Or how about conducting a meeting remotely through a conference call system, thus avoiding travel emissions? Even taking the bus or cycling to work, or simply taking the less-beaten, more traffic-light road with the assistance of your navigator, could have a positive impact.

If nothing else, we should all take this opportunity to see how each one of us can contribute to improving the environment, and our quality of life. Old habits die hard, but if we all band together and learn from the COVID-19 lockdowns and the resulting environmental impacts, we may yet be able to mitigate the effects of pollution and even climate change.

ICEM 2019

I am pleased to announce ICEM2019, the 6th International Conference Energy and Meteorology will be in Copenhagen 24-27th June, 2019.

This unique platform offers you the opportunity to learn how meteorological and climate information can help the energy industry develop more resilient and cleaner energy systems, that will help to mitigate the effects of climate change and global warming.

Make a difference in the Energy & Meteorology World!

I’ve always felt the urge to see my scientific research come out of the computer screen to land on a practical everyday situation. It is often much easier said than done however. As scientists we like to think our research is going to be used by someone one day, but the truth is that most of the time we prefer the comfort of the “ivory tower”. We may feel a sense of relief when, in project proposals, we include the odd sentence about the critical role of our research for society, often added in an attempt to get our proposal across the line.

Oceanography, seasonal climate forecasts and more generally climate research has been a satisfying endeavor for me for many a year but the baby steps in this area of research, despite the size of the effort, had become less and less fulfilling. What a better time then to use weather and climate (collectively referred to as meteorology) observations and forecasts to directly assist society! And what better time to simultaneously assist society in the once-in-a-few-generation overhaul of the energy system! To contribute to the sustainability, resilience and efficiency of energy systems under ever changing weather and climate appeared (and it still does!) like a thrilling goal!

The opportunity arose when in 2005, following the first public dissemination of the winter 2005-06 seasonal climate forecast for Northern Europe by the UK Met Office, the UK energy market appeared to have reacted to the forecast. As we later learnt, towards the end of 2005 the UK was turning from a net exporter of gas to a net importer and that clearly put pressure on gas prices, not so much the climate! Anyhow, this combination of events – issuing of seasonal forecast and spikes in oil prices – were sufficient to attract the attention of a number of scientists and energy practitioners. A public meeting to assess the accuracy of the seasonal forecast and the impact it had on energy market was thus in order: with a colleague we organized such a meeting in London under the auspices of The Royal Meteorological Society (see meeting report: Forecasting UK and European Winters).

The aspiration to more effectively link the energy sector and the weather & climate community had been liberated! The ensuing NATO workshop in 2008 “Weather/Climate Risk Management for the Energy Sector” paved the way to a more formal framework between Energy & Meteorology, and drew a set of recommendations, that, in hindsight, have guided much of activities to come. By the time the recommendations had been written we were becoming increasingly aware that weather and climate information was critical to a very wide range of energy industry activities, and not only with respect to renewable energy generation. From the managing of oil and gas energy supply, to the understanding and estimation of energy demand, to the assessment of meteorological impacts on extraction, transportation, transmission and distribution, meteorological information was demonstrably a key input to energy sector decision-making.

A leap of faith was what it took me to set up the inaugural International Conference Energy & Meteorology (ICEM) in Australia in 2011. Its success in creating a premium international platform with excellent networking opportunities as well as a source of the state-of-the-art in the science, policy, planning and operations in Energy & Meteorology seemingly led to the second ICEM in France in 2013. Almost like a snowball effect, we are now well through the organization of ICEM 2015 which will take place in beautiful Boulder, Colorado in the USA, from 23 to the 26 June 2015.

I strive to instill in each ICEM a strong sense of excitement and novelty, clearly aside from the robust technical content, so that each delegate can enjoy a unique experience. Thus, for ICEM 2015 I am overseeing a number of engaging activities: a fun and didactic competition with which you’ll learn about how cloud movements affect solar radiation on the ground; the launch of a forward-looking international network for the exchange of information between the energy industry and the weather & climate community; the adoption of some of the social media technology during the conference so that you will feel the urge to tweet other delegates about the exciting research and events as they are happening!

I invite you to join the zealous ICEM organizing committee and myself to the ICEM 2015 so that together we can continue to make a difference in the Energy & Meteorology World!

The ICEM 2015 call for abstracts is imminent and closes on Monday 19 January 2015. We have also created a LinkedIn group to facilitate the discussions in Energy & Meteorology.

Alberto Troccoli