After nearly four month since COVID-19 restrictions started in China, global statistics about air quality, as measured by Nitrogen Dioxide (NO2) and Carbon Monoxide (CO), show values still below the 2019 levels but there are indications they are starting to re-bound in some areas.
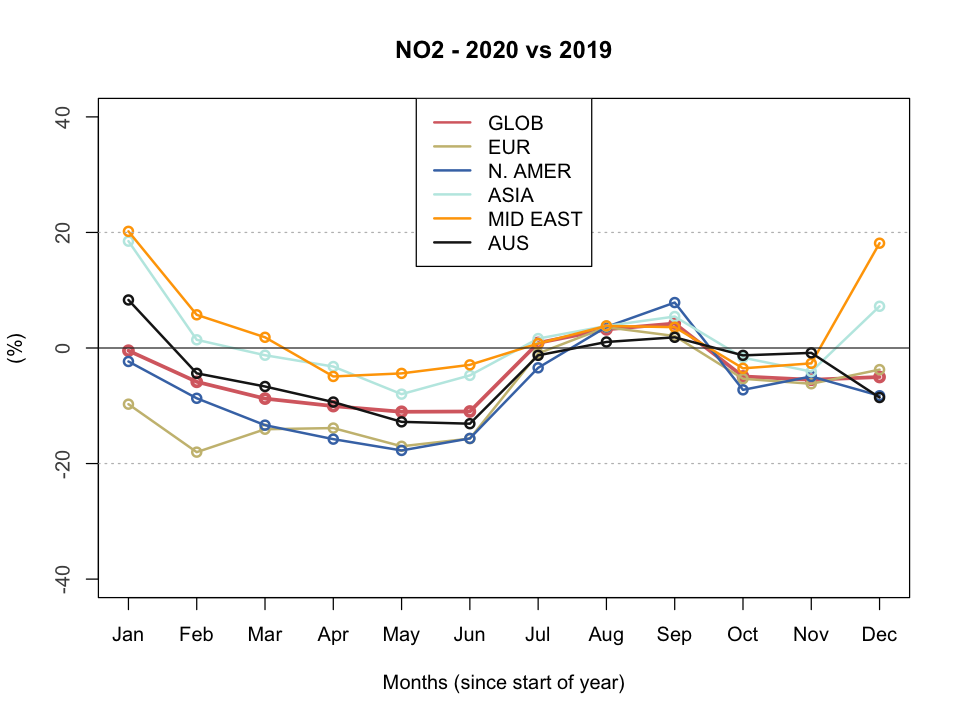
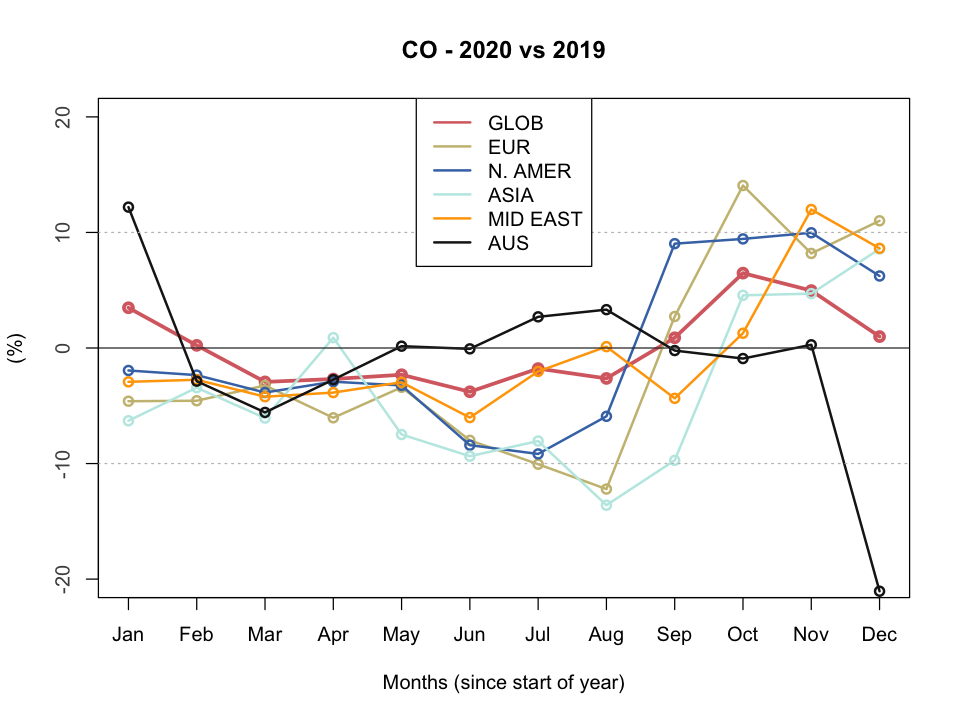
As we discussed in our previous blog post, this unprecedented and dramatic situation has had a beneficial effect on air quality around us and worldwide. After a start of 2020 with NO2 and CO values around or above 2019 levels, the concentration of these two gases over the entire air column have been hovering below 2019 levels. With data for the entire month of April now available, the monthly averages (which provide a more stable statistic than weekly averages) for the first four months of the year display a gradual decline.
Globally, NO2 was 10% below 2019 levels in April; the decrease in CO is less pronounced, and around 5%. Larger reductions can be seen for Europe and North America (around 15%) whereas for most of Asia and he Middle East these were just below zero for NO2; in the case of CO Asia has actually seen a slight increase compared to 2019. Along with April averages, the first eighteen weeks of the year show that both NO2 and CO global means are now starting to re-bound to values closer to 2019 levels, driven by Asia and Middle East for NO2 and North America and Asia for CO.
Nitrogen Dioxide (NO2)
Carbon Monoxide (CO)
The main source of NO2 resulting from human activities is the combustion of fossil fuels (coal, gas and oil) especially fuel used in cars. It is also produced from making nitric acid, welding and using explosives, refining of petrol and metals, commercial manufacturing, and food manufacturing. Inhalation of NO2 increases their risk of respiratory infection and may lead to poorer lung function. CO also is a product of combustion of fuel such as natural gas, coal or wood. Vehicular exhaust contributes to the majority of carbon monoxide let into our atmosphere. CO has been linked to lung diseases.
The data presented here are taken from the Copernicus Atmosphere Monitoring Service (CAMS). Specifically, data come from the CAMS Near Real Time (NRT) Re-analysis which is available a few days behind real time. Re-analyses are combinations of observations (from ground stations, satellite, etc.) and a very advanced physical model. The CAMS NRT Re-analysis is downloaded at ca. 50 km x 50 km horizontal spatial resolution and every six hours (namely four values daily, at 00:00 UTC, 06:00 UTC, 12:00 UTC and 18:00 UTC). More comprehensive data views can be seen in our earlier post.
Data courtesy of Copernicus Atmosphere Monitoring Service (CAMS)